
From the desk of Katusa Research
The Congressional Budget Office projects that within a decade debt held by the public will approach $45 trillion, up 63% from this year.
With trillions of dollars pumped into the system during Covid, directly into individual and corporate bank accounts, the Fed believed that inflation would only be “transitory”.
Transient inflation became the flavor of the day, “it will subside” Central Banks said.
Has inflation truly subsided?
Strip out food and energy and it’s not so bad, one could argue.
But, in case you haven’t seen it, gasoline prices are up 30%, and the price of chicken is up 50% in the past few years.
Want a dozen eggs?
It’ll be 60% more today than in 2021.
Maybe inflation isn’t as transient as they claim.
Gold certainly doesn’t think so.
And the price action in gold is something investors should be paying attention to.
Gold’s U.S. Dollar Price Breakout
Gold is now officially breaking out in every currency including the U.S. dollar, which means it’s in a bull market.
The sneaky rally in gold has now gone full mainstream, yet is receiving no mainstream media attention.
Gold has flirted with all-time highs several times over the past few years, only to snap back, consolidate, and try again…
Which on a long-term time frame is very healthy for a powerful move to come as can be seen in the below chart.
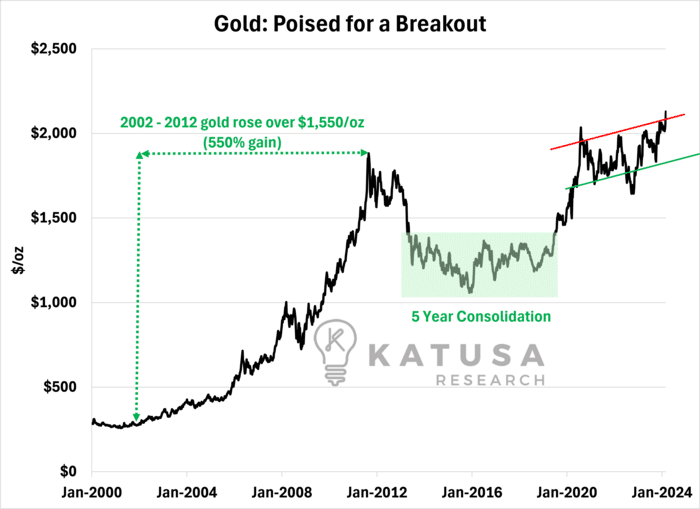
As the chart above shows, gold spent five years in consolidation after soaring 550% over the span of a decade. Then it began its move higher in 2019, bursting to a new high after Covid.
Gold has since spent the last few years inching higher, making higher lows in a tight trading range.
Finally gold popped hard, and it has not looked back.
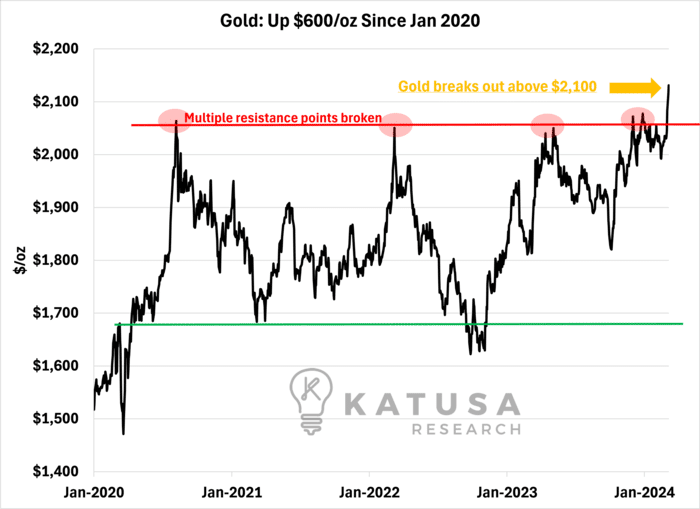
Below is a chart that shows the breakout through the major resistance point, that gold had failed at multiple times.
Gold Prices are Up, Miners are Down
You would think that companies which mine the yellow metal would have chart patterns that are similar.
However, gold producers have not seen anywhere close to the same positive return.
Would you believe it if I told you that gold producers were down 7% over that time frame? And year to date, while gold is up on the year, miners are down nearly 10%.
Newmont, the world's largest gold producer, is trading down over 20% since January 2020 and down 60% from its high set in April 2022.
The chart below shows the widening disconnect in returns that started in mid-2021.
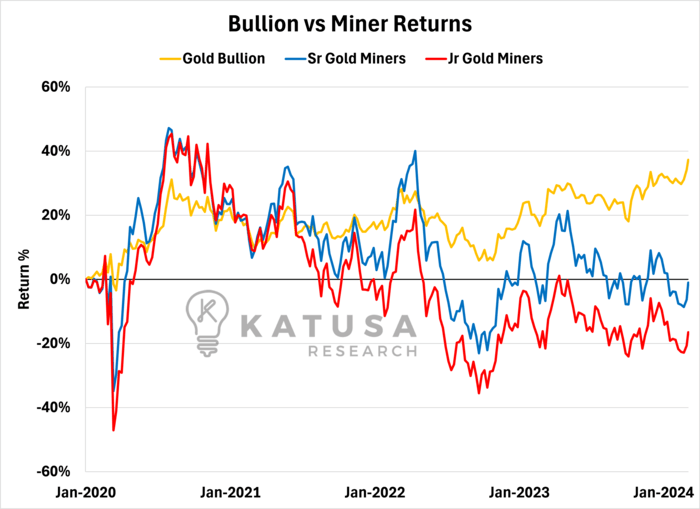
This disconnect widened throughout 2023 and into early 2024.
Looking at mainstream gold miner ETFs, the fund flow into the ETFs has been abysmal, with almost no new money coming into the sector in multiple years.
This is contrary to the bull run from 2010-2012 where the major ETFs saw upwards of $7.5 billion come into the sector.
Are Gold Companies More Profitable?
What I find very interesting is that excluding the year of the pandemic, on average, gold companies are actually more profitable today, than any time in the past 10 years.
For mining, it makes a lot of sense to define it as all-in sustaining cash costs, meaning all those costs related to production, plus salaries, interest expenses, and maintenance capex at mines, relative to the average gold price for the year.
The chart below shows this profitability margin on an annual basis since 2012.
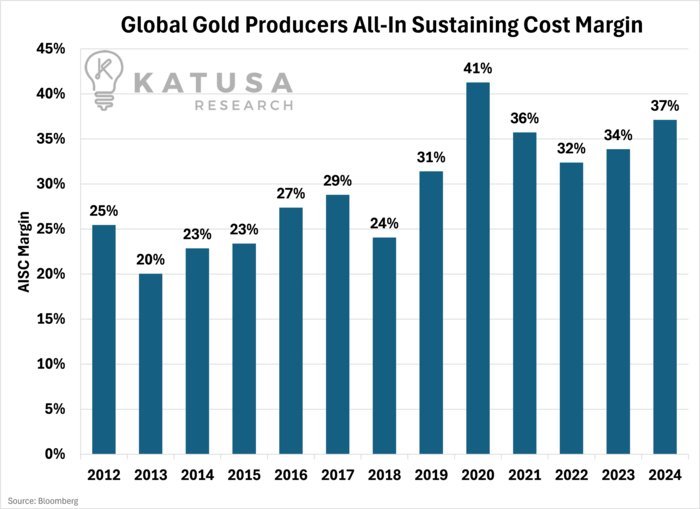
As you can see, over the past 10 years on average it has been an improving trend for miners.
If margins were in the dumps, it would make sense that the gold miners would be hitting all-time lows.
But given that margins are the strongest they’ve been in over a decade, and trending up, could this be gold’s “value investor” moment?
Gold Stocks Are Cheap… For Now
This is very rare: right now, the world’s largest gold companies are trading below net asset value, while those in the “mid-tier” space are trading for as low as 50 cents on the dollar.
I’ve only seen this during the depth of the 2008 Global Financial Crisis.
Valuations based on forward cash flow projections indicate that companies are at levels unseen in many years.
Newmont, the world’s largest gold producer is trading 6x cash flow, the last time that happened was back in 2016.
What I find even more amusing and ironic is the market cap of Newmont is less than the combined market cap of Dogecoin and Shiba Inu, two shit crypto coins.
Which would you rather own?
One that produces almost 5 million ounces and generates over $4 billion in cash from operations or Dogecoin and Shiba Inu?
There are three important takeaways right now:
Gold prices are hovering around all-time highs.
Yet many gold companies are trading at deeply depressed valuations, despite being profitable.
Institutional funds are not yet participating in a big way but this could change at any moment.
All this is shaping up to form what I believe could be the greatest gold company boom of all time – an event that’s 100 years in the making.
In this special report for Porter & Co. readers, I explain exactly how I’m personally positioning myself to take advantage of it, including the companies I’m buying.
Marin Katusa